Latency Numbers “Every Programmer Should Know”
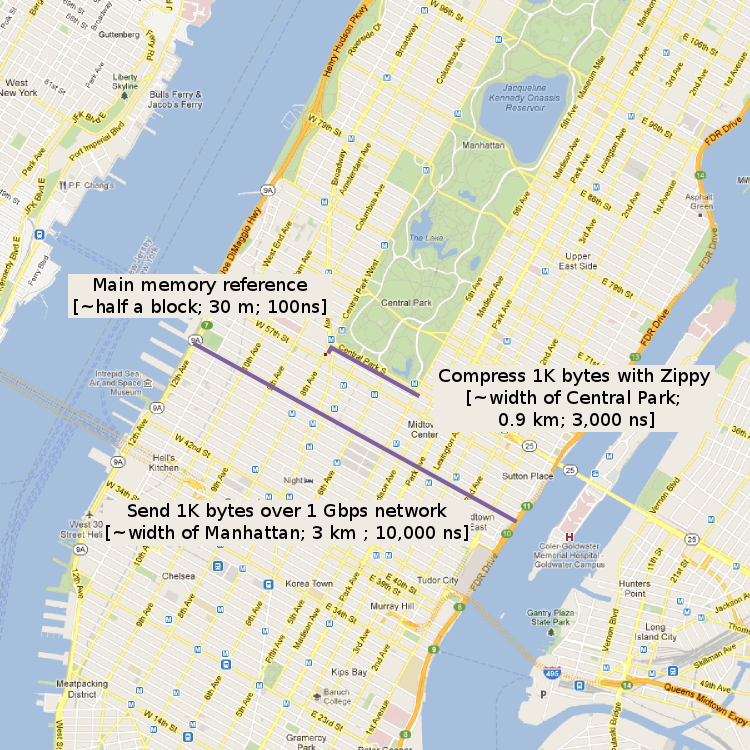
From a presentation by Jeff Dean. What about when technology evolves? Here’s a handy visualization. And here’s a way to think about these numbers. Nathan Hurst visualized the distances on Google Maps1.
| Operation | Time (ns) | Light Distance (m) | Approximate Light Distance |
|---|---|---|---|
| L1 cache reference | 0.5 | 0.15 | Diagonal across your smartphone |
| Branch mispredict | 5 | 1.5 | Height of Natalie Portman |
| L2 cache reference | 7 | 2.1 | Height of Shaq |
| Mutex lock/unlock | 25 | 7.5 | Height of a school flag pole |
| Main memory reference | 100 | 30 | Half a Manhattan city block (North/South) |
| Compress 1K bytes with Zippy | 3,000 | 900 | Width of Central Park |
| Send 1K bytes over 1 Gbps network | 10,000 | 3,000 | Width of Manhattan |
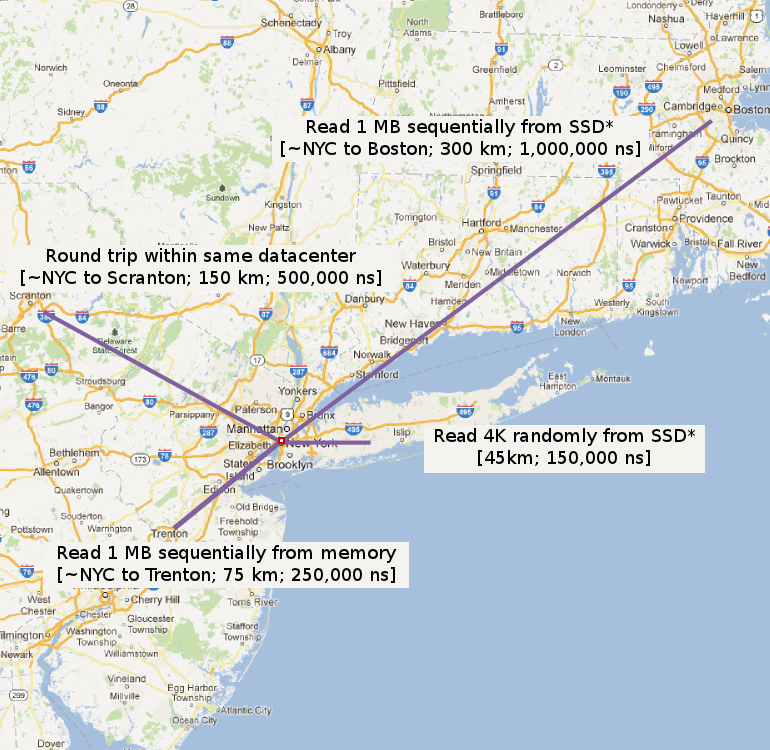
| Read 4K randomly from SSD* | 150,000 | 45,000 | NYC to Hempstead on Long Island |
| Read 1 MB sequentially from memory | 250,000 | 75,000 | NYC to Princeton/Trenton, NJ |
| Round trip within same datacenter | 500,000 | 150,000 | NYC to Scranton, PA |
| Read 1 MB sequentially from SSD* | 1,000,000 | 300,000 | NYC to Boston, MA |
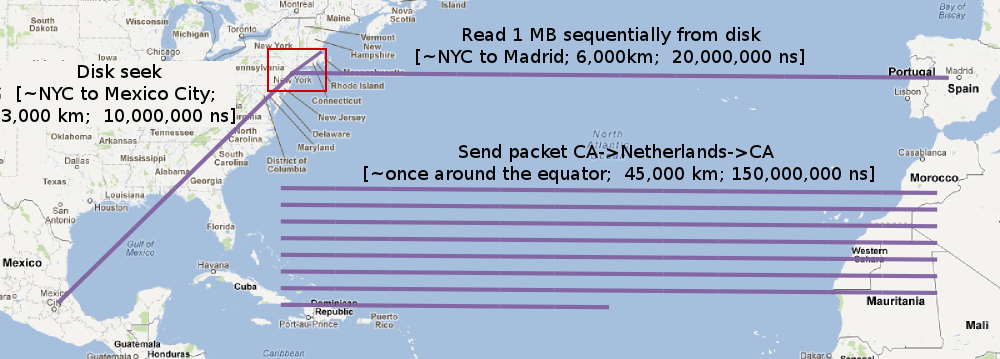
| Disk seek | 10,000,000 | 3,000,000 | NYC to Austin, TX |
| Read 1 MB sequentially from disk | 20,000,000 | 6,000,000 | NYC to Paris, France (also the diameter of the Earth) |
| Send packet CA → Netherlands → CA | 150,000,000 | 45,000,000 | Once around the equator |